Every SIP calculator on the Indian internet — including the one on this site — asks you for three numbers: monthly amount, expected return, number of years. It then shows you a corpus.
That corpus is arithmetically correct and behaviourally fictional. It assumes you make every single instalment, on time, for the entire tenure, and never touch the money.
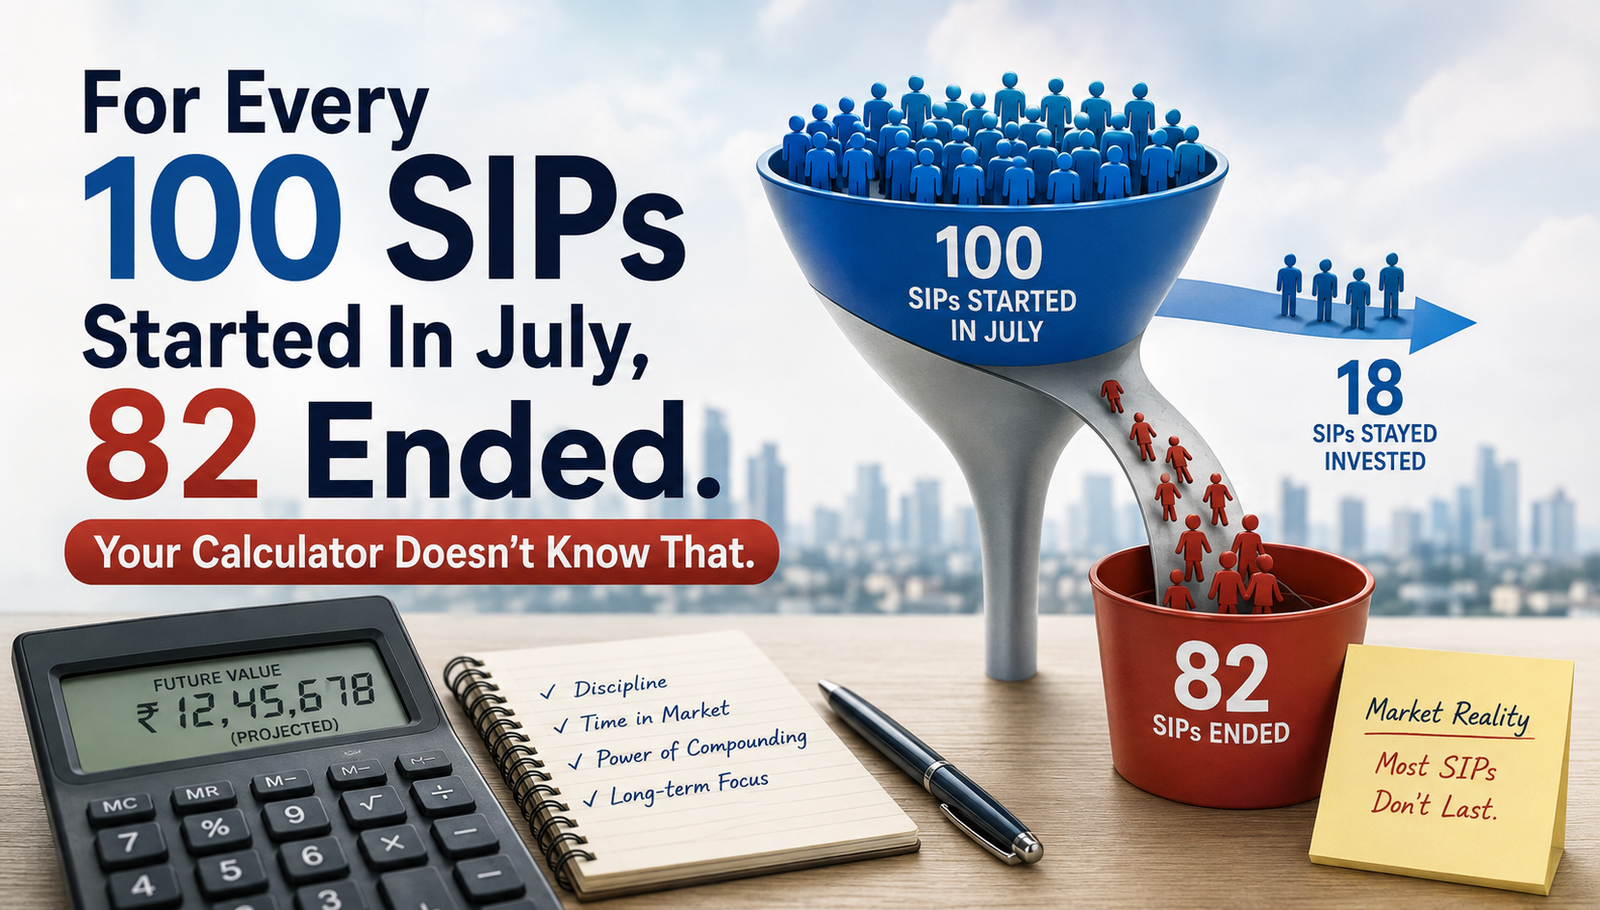
AMFI’s own monthly data suggests that assumption does not describe how Indians actually invest. In July 2026, 61.44 lakh new SIPs were registered and 50.29 lakh either matured or were discontinued — a stoppage ratio of about 81.9%. In June the figure was around 91%. In March and April 2026 it crossed 100%, meaning more SIP accounts ended than started.
This article is about the gap between the projection and the behaviour, and — more usefully — about which kind of stopping actually costs you money. The answer is not the one you have been told.
First, what the stoppage ratio does and does not mean
Most coverage of this number gets it wrong, so it is worth being precise before building anything on top of it.
The SIP stoppage ratio compares SIPs that ended in a month against new SIPs registered in the same month. It is a ratio of two flows. It is not a survival rate, and it does not mean 82 out of every 100 investors quit.
More importantly, AMFI’s published figure lumps together two very different events:
- A completed SIP, where the investor chose a fixed tenure at registration and that tenure has now ended. This is the plan working exactly as designed.
- A discontinued SIP, where the investor cancelled before completion.
AMFI does not separately disclose the split. So a ratio above 100% is not, on its own, evidence of panic. A large block of SIPs registered during the 2023–24 boom reaching their natural end date will push the ratio up while nothing at all has gone wrong.
Anyone writing “four in five Indians are quitting their SIPs” is misreading the data. That is a churn number, not a fear number.
What it does tell you is that the SIP base turns over far more than the compounding story implies. The steady twenty-year investor that every calculator models is a real person, but they are not the median person.
The 2026 picture, in context
The churn sits alongside genuinely strong headline numbers, which is what makes the data interesting rather than alarming.
| Metric (July 2026) | Value |
|---|---|
| Monthly SIP contribution | ₹31,961 crore |
| Year-on-year growth | 12.28% (from ₹28,464 crore) |
| New SIPs registered | 61.44 lakh |
| SIPs matured or discontinued | 50.29 lakh |
| Stoppage ratio | ~81.9% (June: ~91%) |
| SIP-linked assets | ₹18.2 lakh crore |
| Share of industry AUM | ~21.2% |
Contributions have stayed above ₹30,000 crore for five consecutive months. So money keeps arriving even as accounts churn underneath. The reading that fits both facts: a smaller core of persistent, larger investors is carrying the inflow number, while a much larger population cycles in and out.
There is a second, quieter leak worth knowing about. Business Standard, analysing AMFI data, reported that only about 70–80% of active SIP accounts actually contribute in a given month — roughly one in five is paused or hitting a failed transaction. An account can be alive in the statistics and dormant in reality.
What the calculator assumes versus what happens
Take the standard example: ₹10,000 a month, 12% annual return, 20 years. The calculator shows roughly ₹98.9 lakh against ₹24 lakh invested.
Now run the same plan through some realistic interruptions.
| What happens | Total invested | Corpus at year 20 | Versus full plan |
|---|---|---|---|
| Never miss an instalment | ₹24.0 lakh | ₹98.9 lakh | — |
| Two-year pause starting year 8, then resume | ₹21.6 lakh | ₹88.9 lakh | −10% |
| Halve to ₹5,000 after year 10 | ₹18.0 lakh | ₹87.4 lakh | −12% |
| Stop contributing at year 10, stay invested | ₹12.0 lakh | ₹75.9 lakh | −23% |
| Five years in, ten-year gap, resume for last five | ₹12.0 lakh | ₹57.1 lakh | −42% |
Two things fall out of this table that are not obvious.
A pause is not a catastrophe. Skipping two years of instalments in year 8 costs about ₹10 lakh at the end — meaningful, but the plan survives it. The corpus is still roughly 90% of target.
When you stop matters far more than that you stopped. Contributing for the first ten years and then stopping leaves you with ₹75.9 lakh. Contributing for five years, disappearing for ten, and returning for the last five — the same ₹12 lakh of contributions — leaves you with ₹57.1 lakh. The difference is entirely about how long each rupee had to compound.
This is why a missed instalment early is expensive and a missed instalment late is not. One skipped ₹10,000 in month 1 costs about ₹1.08 lakh by year 20. The same ₹10,000 skipped in month 200 costs about ₹15,000.
The finding that contradicts the standard advice
Every article on this subject ends with the same instruction: don’t stop your SIP. The arithmetic says that advice is aimed at the wrong risk.
Compare two investors who both stop contributing at year 10 with ₹23 lakh accumulated.
- Investor A stops the SIP but leaves the money invested. At year 20 she has ₹75.9 lakh.
- Investor B stops the SIP, redeems the ₹23 lakh, spends it, and restarts from zero at year 12. At year 20 he has ₹15.99 lakh.
The cost of stopping contributions is about ₹23 lakh. The additional cost of redeeming is nearly ₹60 lakh.
Redemption is roughly three times as destructive as stopping, and it is the decision almost nobody warns you about — because it does not show up in the stoppage ratio at all. A cancelled SIP where the corpus stays invested and a cancelled SIP where the investor cashes out look identical in AMFI’s data. They are not remotely the same event.
If you are going to break your plan, break it in the survivable direction. Cancel the mandate, keep the units.
Why SIPs actually stop
Not every stoppage is a failure, and it helps to separate the categories, because only some of them are worth defending against.
Ends that are fine:
- The chosen tenure completed as planned.
- The goal was reached and the money was deployed for its purpose.
- The investor consolidated several small SIPs into fewer, larger ones.
- A deliberate switch between schemes or fund houses.
Ends worth preventing:
- The instalment was set too high. The most common failure mode. An amount chosen in a confident month becomes unaffordable in a difficult one.
- A bank balance shortfall. The mandate bounces, sometimes with a bank charge, and after two or three failures people cancel rather than fix it.
- The horizon was wrong for the fund. Money needed in three years placed in a small-cap fund. When the drawdown arrives, stopping feels like risk management. It is really a mismatch that was baked in on day one.
- Return-chasing. Stopping a fund that has underperformed for eighteen months to start one that has just outperformed for eighteen months. This is the expensive one, and it is invisible in the data because it looks like continued investing.
That last category deserves a note in the current environment. In July 2026, small-cap funds took the largest equity inflows at ₹7,767.50 crore and mid-cap funds ₹6,192.31 crore, while large-cap funds saw a net outflow of ₹1,321.69 crore. Money is chasing the segments that have run hardest. Fund managers quoted on the data flagged that valuations in those segments imply high expectations of earnings growth. Whether or not that view proves right, an investor whose SIP is concentrated where returns have been strongest recently is the investor most likely to face the drawdown that triggers a stop.
Building a SIP you will not need to stop
The design decisions that matter are made before the first instalment, not during the drawdown.
Set the instalment at your bad-month income, not your good-month income. A ₹10,000 SIP you sustain for twenty years beats a ₹20,000 SIP you abandon in year six. Using the table above: ₹10,000 held for the full term gives ₹98.9 lakh; ₹20,000 stopped at year six and left invested gives roughly ₹63 lakh. The smaller, survivable number wins.
Use a step-up instead of starting high. Starting at ₹10,000 and increasing 10% each year produces about ₹1.97 crore over twenty years against ₹68.7 lakh contributed. You get the higher number without ever committing to an amount your current salary cannot carry.
Date the mandate to just after your salary credit. Most failed instalments are timing accidents, not affordability problems.
Keep an emergency fund outside the SIP. This is the single highest-value defence. The most common reason a long-running SIP gets redeemed is a medical bill or job gap with nowhere else to draw from. Four to six months of expenses in a liquid instrument protects the compounding you have already banked.
Match the fund’s volatility to the goal’s deadline. Money needed within three to five years should not sit where a 30% drawdown is normal. If you are unsure how to compare what you hold, our note on how mutual fund NAV works covers the basics, and the top mutual funds overview gives the category landscape.
If you must reduce, reduce — do not cancel. Most platforms allow you to lower the instalment or pause for a defined period. Both preserve the units. Cancelling and redeeming does not.
Where this maths breaks
Everything above assumes a flat 12% annual return, and that assumption deserves to be stated plainly rather than buried.
Returns do not arrive evenly. A 12% average across twenty years is not 1% a month. It is several flat years, a violent good year, a drawdown, and so on. The order matters — the same average return with losses concentrated near the end produces a different corpus than one with losses at the start. Calculators cannot model this, and neither can this article.
12% is a historical equity assumption, not a promise. It is not guaranteed, not contractual, and not applicable to every category. Debt and hybrid funds will not deliver it. Neither will an equity fund over a bad decade.
These figures are pre-tax and pre-cost. Expense ratio is deducted from NAV before you see any return. Capital gains tax applies at redemption. The ₹98.9 lakh is a gross number; what reaches your bank account is smaller.
Inflation is not adjusted for. ₹98.9 lakh in twenty years does not buy what ₹98.9 lakh buys today. At 6% inflation it is worth roughly ₹31 lakh in current terms. This is the number the marketing never shows, and it is the one that should drive your target.
The behavioural point cuts both ways. If AMFI’s data says the twenty-year investor is not the median, then the projection is optimistic for most people — but it is not wrong for the person who actually completes the plan. The question is not whether the maths works. It is whether you will still be there when it does.
Frequently asked questions
What is the SIP stoppage ratio? It compares SIP accounts that matured or were discontinued in a month against new SIPs registered in that same month. In July 2026 it was about 81.9% — 50.29 lakh SIPs ended against 61.44 lakh registered.
Does a stoppage ratio above 100% mean investors are panicking? No. AMFI combines completed SIPs — where the chosen tenure simply ended — with cancelled ones, and does not publish the split. A wave of SIPs from the 2023–24 boom reaching their end date pushes the ratio up without any distress.
Is it better to pause a SIP or cancel it? Pause. Pausing stops new contributions but leaves your existing units compounding. On a ₹10,000 monthly plan stopped at year ten, staying invested gives roughly ₹75.9 lakh at year twenty; redeeming and restarting two years later gives roughly ₹16 lakh.
How much does missing a few instalments actually cost? Less than most people fear, and it depends heavily on timing. A two-year pause in year eight of a twenty-year plan reduces the final corpus by about 10%. But a single ₹10,000 instalment missed in month one costs about ₹1.08 lakh by year twenty, while the same instalment missed in month 200 costs about ₹15,000.
Should I reduce my SIP amount if money is tight? Yes — reducing is almost always better than cancelling. Halving a ₹10,000 SIP after year ten still produces about ₹87.4 lakh, roughly 88% of the uninterrupted outcome, and it keeps the mandate alive so you can step it back up later.
Is ₹10,000 a month enough? It depends entirely on the goal and the deadline, not on the amount in isolation. At 12% over twenty years it projects to about ₹98.9 lakh gross — but adjusted for 6% inflation that is worth roughly ₹31 lakh in today’s money. Set the target in real terms first, then work backwards to the instalment.
The one-line version
The calculator is not lying to you. It is answering a question you did not ask — what happens if nothing goes wrong. AMFI’s data describes a market where something usually does.
Plan for the interruption instead of assuming it away: size the instalment for your worst month, keep an emergency fund so you never have to redeem, and if you have to stop, stop the mandate rather than the investment. The difference between those last two choices was ₹60 lakh in the example above, and it is the difference nobody puts in the calculator.
Sources: AMFI monthly data for July 2026 as reported by 5paisa, ANI, IANS and The Tribune (11 August 2026); AMFI stoppage ratio analysis for March–April 2026; Business Standard analysis of contributing versus active SIP accounts. Corpus figures are calculated by Diving Finance using standard SIP future-value maths at 12% annual return compounded monthly, and are illustrative rather than predictive.
This article is for information and education. It is not investment advice. Mutual fund investments are subject to market risk; read all scheme-related documents carefully. Consider speaking to a SEBI-registered investment adviser before acting on anything here.