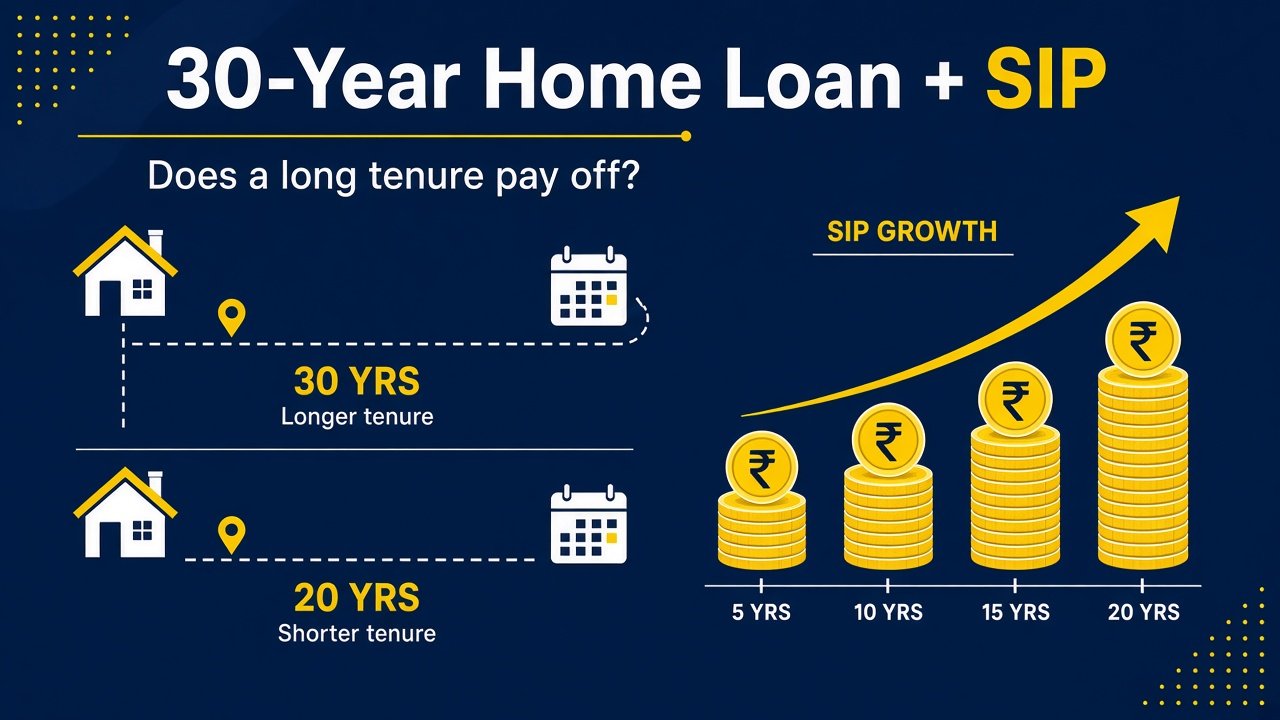
Short answer: a 30-year home loan pays off only if you actually invest the EMI you save and that money earns more than your loan costs. On a ₹50.00 lakh loan at an assumed 8.5%, the 30-year EMI is ₹38,446 against ₹43,391 for 20 years, a gap of ₹4,945 a month. Put that gap in an equity SIP and you need roughly 8.78% a year to break even with the 20-year borrower by year 20 (9.48% after 12.5% LTCG and 4% cess). At an assumed 12% you come out about ₹14.48 lakh ahead at year 20; at 8% you end up ₹2.69 lakh behind. Use bonuses to prepay, and the 30-year loan can close in about 12.6 years. Try your own numbers in the calculator below.
Key Highlights
- The trade-off: stretching ₹50.00 lakh from 20 to 30 years cuts the EMI by ₹4,945 but adds ₹34.27 lakh of interest (8.5% assumed).
- Break-even: the SIP must earn about 8.78% a year before tax (9.48% after LTCG) to beat a 20-year loan at 8.5%. At 7.5% the bar is 7.71%; at 9.5% it is 9.86%.
- Bonuses change everything: a ₹2.00 lakh prepayment every year closes the 30-year loan in about 12.6 years and saves ₹56.41 lakh of interest.
- Tax (as of 22 Oct 2026): under the Income-tax Act, 2025, in force from 1 April 2026, self-occupied home-loan interest is deductible up to ₹2 lakh only in the old regime. The default new regime gives nothing for it.
- Biggest risk: discipline. If the EMI saving is spent rather than invested, the 30-year loan is simply the costlier loan.
Why is a 30-year home loan cheaper per month but costlier overall?
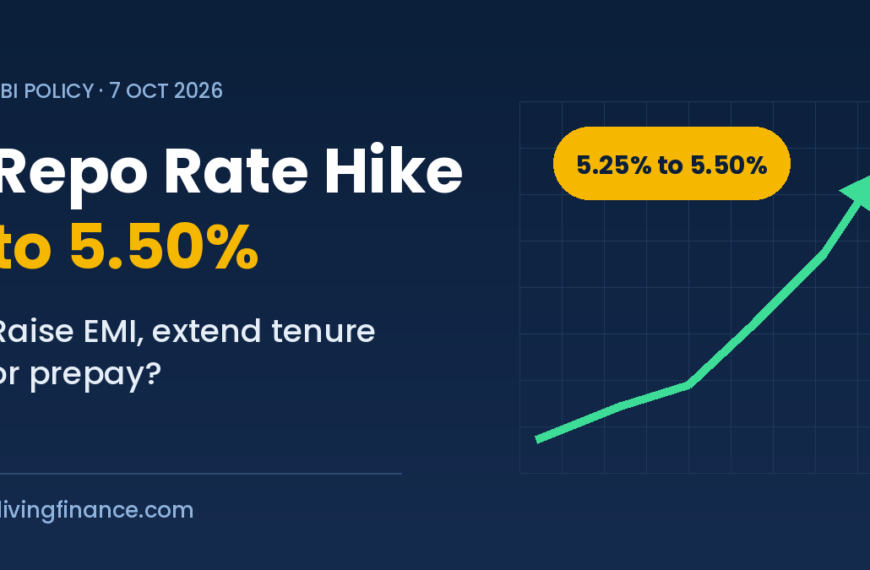
Because you repay principal more slowly, so interest runs on a bigger balance for longer. Here is a ₹50.00 lakh loan at an assumed 8.5% floating rate. For context, the RBI raised the repo rate by 25 bps to 5.50% on 7 October 2026 (RBI MPC resolution, 7 Oct 2026), and SBI’s EBLR moved to 8.15% + CRP + BSP effective 15 October 2026 (SBI EBLR page, checked 22 Oct 2026). Most salaried borrowers pay a spread on top, so 8.5% is a working figure, not a quote.
| Tenure | EMI | Total interest | Total paid |
|---|---|---|---|
| 20 years | ₹43,391 | ₹54.14 lakh | ₹104.14 lakh |
| 25 years | ₹40,261 | ₹70.78 lakh | ₹120.78 lakh |
| 30 years | ₹38,446 | ₹88.40 lakh | ₹138.40 lakh |
Going from 20 to 30 years saves you ₹4,945 a month but costs ₹34.27 lakh more in interest. Seen alone, that looks like a bad deal. The question is what the ₹4,945 does for 20 years. You can test any loan in our home loan EMI calculator.
Does a 30-year loan plus SIP beat a 20-year loan?
Here is a fair test with equal cash flows. Years 1 to 20: both borrowers spend ₹43,391 a month. The 20-year borrower pays it all as EMI; the 30-year borrower pays ₹38,446 EMI and SIPs the ₹4,945 difference. Years 21 to 30: both spend ₹38,446 a month. The 30-year borrower keeps paying EMI; the now debt-free 20-year borrower invests the same ₹38,446 at the same return. Net advantage = (30-year borrower’s corpus minus loan still owed) minus (20-year borrower’s corpus minus loan owed).
| SIP return (assumed) | SIP corpus at year 20 | Loan still owed at year 20 | Net advantage at year 20 | Net advantage at year 30 |
|---|---|---|---|---|
| 8% | ₹28.32 lakh | ₹31.01 lakh | -₹2.69 lakh | -₹8.55 lakh |
| 10% | ₹35.80 lakh | ₹31.01 lakh | ₹4.80 lakh | ₹15.42 lakh |
| 12% | ₹45.49 lakh | ₹31.01 lakh | ₹14.48 lakh | ₹55.16 lakh |
Sensitivity: SIP return vs loan rate
The answer depends almost entirely on the gap between your loan rate and your SIP return. This grid uses the same ₹50 lakh loan and the same equal-cash-flow rule for every cell. Each cell shows the net advantage of the 30-year loan + SIP over the 20-year loan, pre-tax / after LTCG, in ₹ lakh.
| Loan rate | SIP return | Year 20 (pre-tax / post-LTCG) | Year 30 (pre-tax / post-LTCG) |
|---|---|---|---|
| 7.5% | 6% | -5.22 / -6.55 | -13.68 / -15.69 |
| 7.5% | 8% | +1.01 / -1.13 | +2.38 / -1.72 |
| 7.5% | 10% | +9.06 / +5.87 | +29.45 / +21.83 |
| 7.5% | 12% | +19.47 / +14.94 | +73.63 / +60.27 |
| 8.5% | 6% | -8.47 / -9.70 | -22.41 / -23.95 |
| 8.5% | 8% | -2.69 / -4.66 | -8.55 / -11.90 |
| 8.5% | 10% | +4.80 / +1.85 | +15.42 / +8.96 |
| 8.5% | 12% | +14.48 / +10.27 | +55.16 / +43.53 |
| 9.5% | 6% | -11.70 / -12.81 | -31.40 / -32.45 |
| 9.5% | 8% | -6.36 / -8.17 | -19.79 / -22.35 |
| 9.5% | 10% | +0.55 / -2.16 | +1.00 / -4.26 |
| 9.5% | 12% | +9.49 / +5.62 | +36.20 / +26.36 |
| Loan rate | Break-even SIP return, year 20 | Year 20 after LTCG | Break-even, year 30 | Year 30 after LTCG |
|---|---|---|---|---|
| 7.5% | 7.71% | 8.36% | 7.76% | 8.19% |
| 8.5% | 8.78% | 9.48% | 8.84% | 9.26% |
| 9.5% | 9.86% | 10.61% | 9.92% | 10.35% |
Read the grid this way: a 6% SIP loses at every loan rate (as much as ₹31.40 lakh by year 30 at 9.5%). At 10%, the strategy is comfortably ahead at 7.5% (+₹5.87 L after tax at year 20) but slightly behind after tax at 9.5% (-₹2.16 L). Model your own SIP in the SIP returns calculator.
Methodology: how we calculated this
- Loan EMI: EMI = P x r x (1+r)n / ((1+r)n – 1), with r = annual rate / 12 and n = months. Interest is charged monthly on the reducing balance, which is how Indian banks quote floating home-loan rates.
- SIP return: we use the effective monthly rate rm = (1+R)1/12 – 1, not R/12. Fund returns are quoted as annualised CAGR, so this makes a 10% assumption grow exactly 10% a year. R/12 would quietly overstate returns (10% would become 10.47% a year). We use it consistently in every table and in the calculator.
- SIP timing: contributions go in at the start of each month and earn that month’s return. EMIs are paid at the end of the month.
- Equal cash flows: both borrowers spend the shorter-tenure EMI each month until that loan ends, then both spend the longer-tenure EMI until year 30. Whatever is not paid as EMI is invested at the same assumed return.
- Prepayments: applied to principal at the end of the 12th month of the chosen year(s). The EMI stays unchanged and the tenure shortens. Once a loan is closed, later lump sums and the freed EMI are invested. No prepayment charge, in line with the RBI Directions for floating-rate loans to individuals (see Sources).
- Loan rate: floating, but held constant for the full term (7.5%, 8.5%, 9.5% scenarios). Real floating rates will move with the repo rate.
- Tax: the sensitivity grid ignores income-tax deductions. Old-regime scenarios cap self-occupied interest at ₹2 lakh a year, multiply by the chosen slab (30% in our example) plus 4% cess, and invest the saving at the end of each year. New regime: no deduction. LTCG: 12.5% plus 4% cess on gains above ₹1.25 lakh, applied once at exit. Spreading redemptions over several years to use the exemption every year would lower the tax, so our after-tax figures are conservative. Surcharge is ignored.
- Inflation: 6% a year, used only to express future EMIs in today’s money.
- Rounding: calculations use unrounded values; EMIs are shown to the nearest rupee and totals to ₹0.01 lakh. Small differences of ₹0.01 lakh between tables are rounding.
What if I prepay with my bonus every year?
This is where the long tenure really earns its keep. The low EMI stays your floor, and a lump sum like a ₹2.00 lakh bonus goes straight to principal. Keeping the EMI unchanged:
| Loan | Prepay ₹2 lakh | Loan closes in | Total interest | Interest saved |
|---|---|---|---|---|
| 30-yr | every year | 12.6 years | ₹32.00 lakh | ₹56.41 lakh |
| 30-yr | every 3 years | 20.4 years | ₹55.88 lakh | ₹32.52 lakh |
| 20-yr | every year | 11.0 years | ₹27.13 lakh | ₹27.01 lakh |
| 20-yr | every 3 years | 15.8 years | ₹41.65 lakh | ₹12.49 lakh |
A 30-year loan with a yearly ₹2.00 lakh prepayment closes in about 12.6 years, faster than a plain 20-year loan, while your committed EMI is only ₹38,446. If a bonus does not come in some year, nothing breaks. To weigh a specific prepayment against investing it, use our home loan prepayment vs investment calculator.
Which tenure should you choose? Our analysis
When the 20-year loan is preferable
- Your expected return is close to, or below, your loan rate. At a 9.5% loan and a 10% SIP, the 30-year route is -₹2.16 L after tax at year 20. The edge vanishes once the rate gap is under about 1 percentage point.
- You have a low risk appetite. If you would hold debt funds or FDs (about 6%), the 30-year route loses ₹8.47 lakh by year 20 at 8.5%.
- Your SIP discipline is weak. If the ₹4,945 is spent, you simply pay ₹34.27 lakh more interest.
- You are near retirement. A 30-year loan taken at 45 still has ₹39.04 lakh outstanding at 60 (of ₹50 lakh at 8.5%).
- You are in the new tax regime. It gives no interest deduction, so the long loan earns no tax help. In the old regime at 30%, break-even at 8.5% drops from 8.78% to 8.27% because the 30-year loan keeps hitting the ₹2 lakh cap for longer.
When the 30-year loan helps
- Cash-flow flexibility. Your committed EMI is ₹4,945 lower (₹38,446 vs ₹43,391). You can always pay more, but you cannot easily pay less.
- Variable income. Commission, business or freelance income: keep the low EMI as the floor and prepay in good years. A yearly ₹2 lakh prepayment still closes the loan in 12.6 years.
- Young borrowers with a long horizon. With 30 years to compound, a 12% SIP is +₹43.53 L ahead at year 30 after tax; even 10% gives +₹8.96 L.
- Emergency buffer. The SIP corpus is liquid. At 10% it is about ₹35.80 lakh by year 20; a prepayment, once made, cannot be withdrawn.
When prepaying beats investing
- Your loan rate is above your post-tax expected return. For yearly ₹2 lakh lump sums on the 30-year loan, investing beats prepaying only above about 9.24% after LTCG at 8.5%, and 10.32% at 9.5%. At 9.5% and a 10% return, prepaying leaves you ₹8.33 lakh better off by year 30.
- Lump sums. Bonuses are the best prepayment money: a single ₹2 lakh paid at the end of year 1 on the 30-year loan saves ₹17.47 lakh of interest and cuts 50 months.
- Early years. In year 1, 91.8% of the 30-year EMI is interest (vs 80.9% on 20 years). The same ₹2 lakh prepaid in year 15 saves only ₹4.72 lakh and 17 months.
- Peace of mind. Prepayment is a guaranteed, risk-free return equal to your loan rate. If market falls would make you stop your SIP, prepay instead.
Expert take by Ashutosh Joshi
“I usually tell salaried clients to take the longest tenure the bank allows, up to 30 years, so the EMI stays comfortable even if rates or jobs change. Then I set the gap between a 20-year and a 30-year EMI, here about ₹4,945, as an auto-debit SIP on salary day. Every bonus or windfall goes to prepayment. You get a low fixed commitment, a growing investment, and a loan that can still close in around 12 to 13 years.
The numbers set the limits. This works when your equity SIP can reasonably beat the loan rate by 1.5 to 2 points after tax. At 8.5%, the bar is about 9.48% after LTCG. If your loan is at 9.5% or more, or you would not stay invested through a crash, take the 20-year loan or prepay harder. The plan fails only if the SIP is skipped, so automate it and do not touch it.”
Ashutosh Joshi, PGDM (Finance), B.Com
Calculator: compare two tenures with your numbers
Enter your loan, two tenures, your expected SIP return, tax regime and any prepayment plan. The tool uses exactly the method above (equal cash flows, monthly compounding, LTCG at exit), so with the default inputs it reproduces the 8.5% / 10% row of our tables.
Result
Equal cash flows: both borrowers spend the shorter EMI until loan A ends, then the longer EMI; any amount not paid as EMI is invested at the expected return (start of month). Lump sums apply at the end of each chosen year, EMI unchanged. Old-regime tax saving is invested at year end. Step-up is added to both budgets, so it grows both corpora equally. Illustrative only, rates held constant.
Questions people also ask
Is the ₹4,945 SIP enough on its own?
Not really. It is a starting point. As your salary grows, raise it every year; a 10% annual step-up is a common default. Try it in our step-up SIP calculator. Also remember inflation: at an assumed 6% a year, the ₹38,446 EMI feels like about ₹11,988 in today’s money by year 20, so the later years get easier.
What happens if rates rise again?
A long loan is more sensitive. If the rate moves from 8.5% to 9.5%, the 30-year EMI rises from ₹38,446 to ₹42,043, and the 20-year EMI from ₹43,391 to ₹46,607. The RBI changed its stance to ‘calibrated tightening’ on 7 Oct 2026, so further hikes are possible. Read how the October hike hit borrowers in our repo rate hike EMI vs tenure guide, and track the policy rate on the RBI repo rate page.
Does the old tax regime make a 30-year loan better?
A little. Year-1 interest on ₹50.00 lakh at 8.5% is about ₹4.24 lakh on either tenure, above the ₹2 lakh cap. The cap binds for 23 years on the 30-year loan against 14 on the 20-year loan. At a 30% slab plus cess, with the tax saving invested at 10%, the year-20 advantage rises from ₹4.80 lakh to ₹6.64 lakh pre-tax (₹3.50 lakh after LTCG). Helpful, not decisive. See old vs new tax regime.
When does a long tenure not work?
- You will not invest the EMI saving automatically, on the same date, every month.
- You would stop the SIP after a market fall.
- Your loan rate is high (break-even at 9.5% is 10.61% after tax) or you have no emergency fund.
- You are close to retirement and a 30-year term runs past your working life.
Quick reference: EMI per ₹10 lakh
| Rate | 10 yrs | 15 yrs | 20 yrs | 25 yrs | 30 yrs |
|---|---|---|---|---|---|
| 8.0% | ₹12,133 | ₹9,557 | ₹8,364 | ₹7,718 | ₹7,338 |
| 8.5% | ₹12,399 | ₹9,847 | ₹8,678 | ₹8,052 | ₹7,689 |
| 9.0% | ₹12,668 | ₹10,143 | ₹8,997 | ₹8,392 | ₹8,046 |
| 9.5% | ₹12,940 | ₹10,442 | ₹9,321 | ₹8,737 | ₹8,409 |
Before you pick a tenure, check the latest benchmark rates on our live rates page and, if you are still deciding where the SIP goes, read how much a ₹10,000 monthly SIP can grow to and how to get out of debt faster.
FAQs
Is a 30-year home loan a good idea in India?
It is a good idea if you invest the EMI saving and prepay with lump sums. On ₹50 lakh at 8.5%, it adds ₹34.27 lakh of interest if you do neither.
What SIP return do I need to beat a 20-year loan?
About 8.78% a year before tax, or about 9.48% after 12.5% LTCG, for a ₹50 lakh loan at 8.5%. At 7.5% the pre-tax bar is 7.71%; at 9.5% it is 9.86%.
Should I prepay my home loan or invest in SIP?
Do both: invest the monthly EMI saving in a SIP and use one-time bonuses to prepay. Prepayment gives a guaranteed return equal to your loan rate; at 8.5%, investing lump sums only wins above about 9.24% after tax.
Can I claim home loan interest in the new tax regime?
Not for a self-occupied house. Under the Income-tax Act, 2025 (in force from 1 April 2026), the up to ₹2 lakh interest deduction is available only in the old regime.
Are there prepayment charges on floating-rate home loans?
Generally no. Under the RBI (Pre-payment Charges on Loans) Directions, 2025, lenders cannot charge prepayment penalties on floating-rate loans to individuals for non-business purposes sanctioned or renewed on or after 1 January 2026. Older floating-rate home loans were also largely exempt under earlier RBI rules; check your sanction letter.
Sources
- RBI, Monetary Policy Statement 2026-27: Resolution of the MPC, 5-7 October 2026 (press release dated 7 Oct 2026): repo rate raised 25 bps to 5.50%; stance changed to calibrated tightening. Accessed 22 Oct 2026.
- RBI (Pre-payment Charges on Loans) Directions, 2025 (RBI/2025-26/64, 2 July 2025): no pre-payment charges on floating-rate loans to individuals for non-business purposes, for loans sanctioned or renewed on or after 1 Jan 2026. Accessed 22 Oct 2026.
- SBI, External Benchmark based Lending Rate: EBLR 8.15% + CRP + BSP effective 15 Oct 2026 (page last updated 14 Oct 2026). Accessed 22 Oct 2026.
- Income Tax Department, House Property: self-occupied interest deduction limited to ₹2,00,000 (loan for purchase/construction on or after 1 April 1999, completed within 5 years); not allowed under the default new regime. Accessed 22 Oct 2026.
- Income Tax Department, Tax on long-term capital gains: LTCG on equity shares and equity-oriented fund units taxed at 12.5% on gains above ₹1,25,000 for transfers on or after 23 July 2024 (Finance (No. 2) Act, 2024). Accessed 22 Oct 2026.
- Income-tax Act, 2025 as amended by the Finance Act, 2026 (official text, incometaxindia.gov.in): the Act in force from 1 April 2026 that replaces the 1961 Act. The official PDF could not be opened on 22 Oct 2026, so we have not checked the section numbers against it; the deduction and LTCG rules above follow the Income Tax Department pages.
By Ashutosh Joshi, PGDM (Finance), B.Com. Published 22 October 2026; last updated 22 October 2026 (added sources, methodology, sensitivity grid, decision guide and calculator). All figures are illustrative calculations, not advice; returns shown are assumptions.